A Simple Way to Show 2D Transformations with Matplotlib
About
While studying linear algebra it might be nice to visualize
some 2D transformations to get a feeling what those different matrices
actually do.
It is also an amazing way to procrastinate when you are in need to
study for a midterm :).
Code
We will be using matplotlib.pyplot.
By searching the web it seems there are two obvious ways to do it.
You can use streamplot
or simple quiver.
Although you can do some really cool stuff with streamplot (like
this)
I think quiver can look good without much work whereas to make
streamplot appealing one must fiddle with more parameters.
To keep this simple (and allow me to get back to studying) we will stick
with quiver.
We can construct the plot with simple function.
defshow_plot(X, Y, U, V):
plt.figure(figsize=(7,7))
plt.quiver(X, Y, X, Y, color='dodgerblue')
plt.quiver(X, Y, U, V, color='red')
plt.show()
All parameters are matrices.
The first two specify the starting points of vectors.
The other two their directions.
Observe the line
plt.quiver(X, Y, X, Y, color='dodgerblue').
All it does is that it displays blue vectors as if no transformation was applied.
This makes it easier to see the difference between
the original vectors and the resulting.
To generate the first two matrices we can use numpy:
X = np.arange(-10,10,1.5)
Y = np.arange(-10,10,1.5)
X, Y = np.meshgrid(X, Y)
With this, we can easily change the density of vectors by changing the 1.5 step parameter.
Now, because we would like to study matrices we need to find a way to
apply them to the given X/Y field.
Here is not very effective but a straightforward way to transform the plane with a
2×2 matrix.
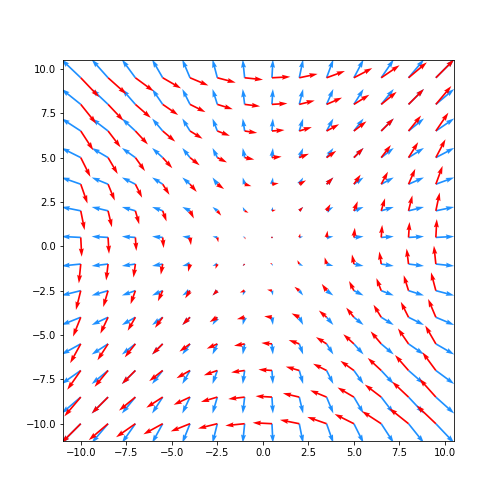
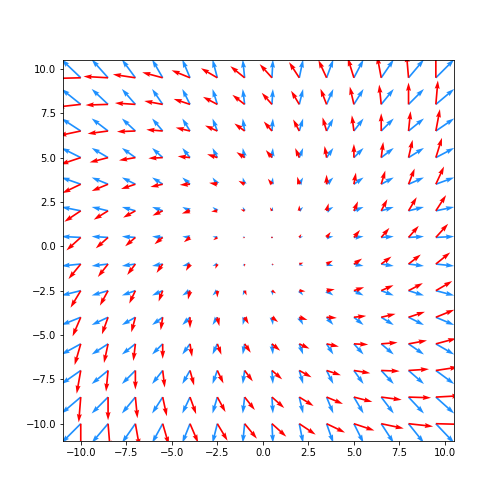
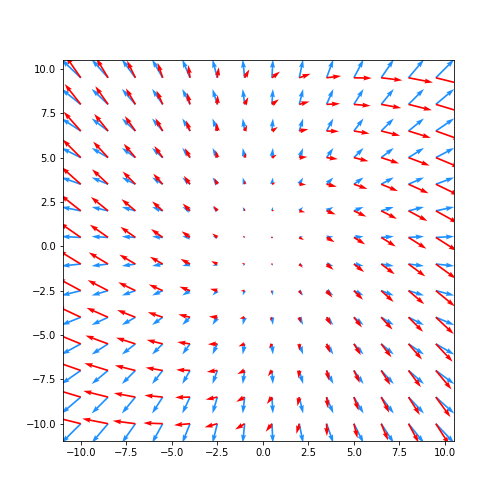
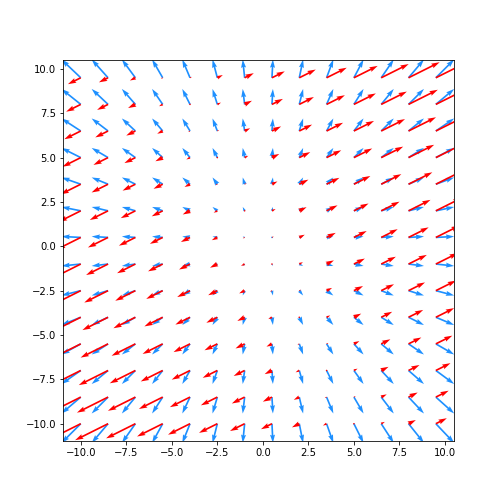
This is pretty much all we need. Here are some results :)
Reflection, axis of the 1st and 4th quadrants45° rotationSomething quite random where no vector should end where it startedOrthogonal projection on the line (2,1)T
I realized this only later but this approach won't allow us to rescale vectors
easily (no homothety, sorry).
However, it should be possible to change the scale with parameters to quiver.